Questions? Complaints? Concerns?

Dashboard Performance Measures

The information in this dashboard has been provided by the Michigan Transportation Asset Management Council for the State of Michigan. Menus within this dashboard allow for drilling down to specific information within Bay County.

NOTE: As there is a large amount of data provided by Asset Management, available information (links) takes a few moments to initialize.
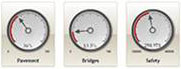
.Pavement
.Bridges
.Safety
PAVEMENT CONDITION
Percent of Federal Aid Paved Roads in Poor Condition
BRIDGE CONDITION

Percent of Structurally Deficient Bridges

SAFETY

Total Traffic Crashes for Previous Year

MAINTENANCE

Total Cost of Maintenance

FINANCE

Financial Expenditure Totals

.Maintenance
.Finance

The information in this dashboard shows the condition, operation, and investment in Michigan’s public road system. Pavement condition information is based on paved surface ratings for state highways as well as roads under the jurisdiction of Michigan’s counties, cities and villages. Statewide there are over 10,000 public road bridges. Bridge conditions are based on bi-annual inspections of state, county, city and village owned bridges. The number of traffic accidents is a measure of how effectively the road system is performing. Maintenance is required to keep roads and bridges performing as intended. These activities include: snow removal, patching, grading, and mowing. Capital investments are necessary to extend the useful life of any asset including roads and bridges. The financial pie charts illustrate how investments in the road and bridge system are made.